hypatia-impl
Hypatia
Hypatia is a low earth orbit (LEO) satellite network simulation framework. It pre-calculates network state over time, enables packet-level simulations using ns-3 and provides visualizations to aid understanding.
It consists of four main components:
-
satgenpy: Python framework to generate LEO satellite networks and generate routing over time over a period of time. It additionally includes several analysis tools to study individual cases. It makes use of several Python modules among which: numpy, astropy, ephem, networkx, sgp4, geopy, matplotlib, statsmodels, cartopy (and its dependent (data) packages: libproj-dev, proj-data, proj-bin, libgeos-dev), and exputil. More information can be found insatgenpy/README.md. (license: MIT) -
ns3-sat-sim: ns-3 based framework which takes as input the state generated bysatgenpyto perform packet-level simulations over LEO satellite networks. It makes use of thesatellitens-3 module by Pedro Silva to calculate satellite locations over time. It uses thebasic-simns-3 module to make e.g., running end-to-end TCP flows easier, which makes use of several Python modules (e.g., numpy, statsmodels, exputil) as well as several other packages (e.g., OpenMPI, lcov, gnuplot). More information can be found inns3-sat-sim/README.md. (license: GNU GPL version 2) -
satviz: Cesium visualization pipeline to generate interactive satellite network visualizations. It makes use of the online Cesium API by generating CesiumJS code. The API calls require its user to obtain a Cesium access token (via https://cesium.com/). More information can be found insatviz/README.md. (license: MIT) -
paper: Experimental and plotting code to reproduce the experiments and figures which are presented in the paper. It makes use of several Python modules among which: satgenpy, numpy, networkload, and exputil. It uses the gnuplot package for most of its plotting. More information can be found inpaper/README.md. (license: MIT)
(there is a fifth folder called integration_tests which is used for integration testing purposes)
This is the code repository introduced and used in “Exploring the “Internet from space” with Hypatia” by Simon Kassing, Debopam Bhattacherjee, André Baptista Águas, Jens Eirik Saethre and Ankit Singla (*equal contribution), which is published in the Internet Measurement Conference (IMC) 2020.
BibTeX citation:
@inproceedings {hypatia,
    author = {Kassing, Simon and Bhattacherjee, Debopam and Águas, André Baptista and Saethre, Jens Eirik and Singla, Ankit},
    title = ,
    booktitle = ,
    year = {2020}
}
Getting started
- System setup:
- Python version 3.7+
- Recent Linux operating system (e.g., Ubuntu 18+)
- Install dependencies:
bash hypatia_install_dependencies.sh - Build all four modules (as far as possible):
bash hypatia_build.sh - Run tests:
bash hypatia_run_tests.sh - The reproduction of the paper is essentially the tutorial for Hypatia.
Please navigate to
paper/README.md.
Visualizations
Most of the visualizations in the paper are available here.
All of the visualizations can be regenerated using scripts available in satviz as discussed above.
Below are some examples of visualizations:
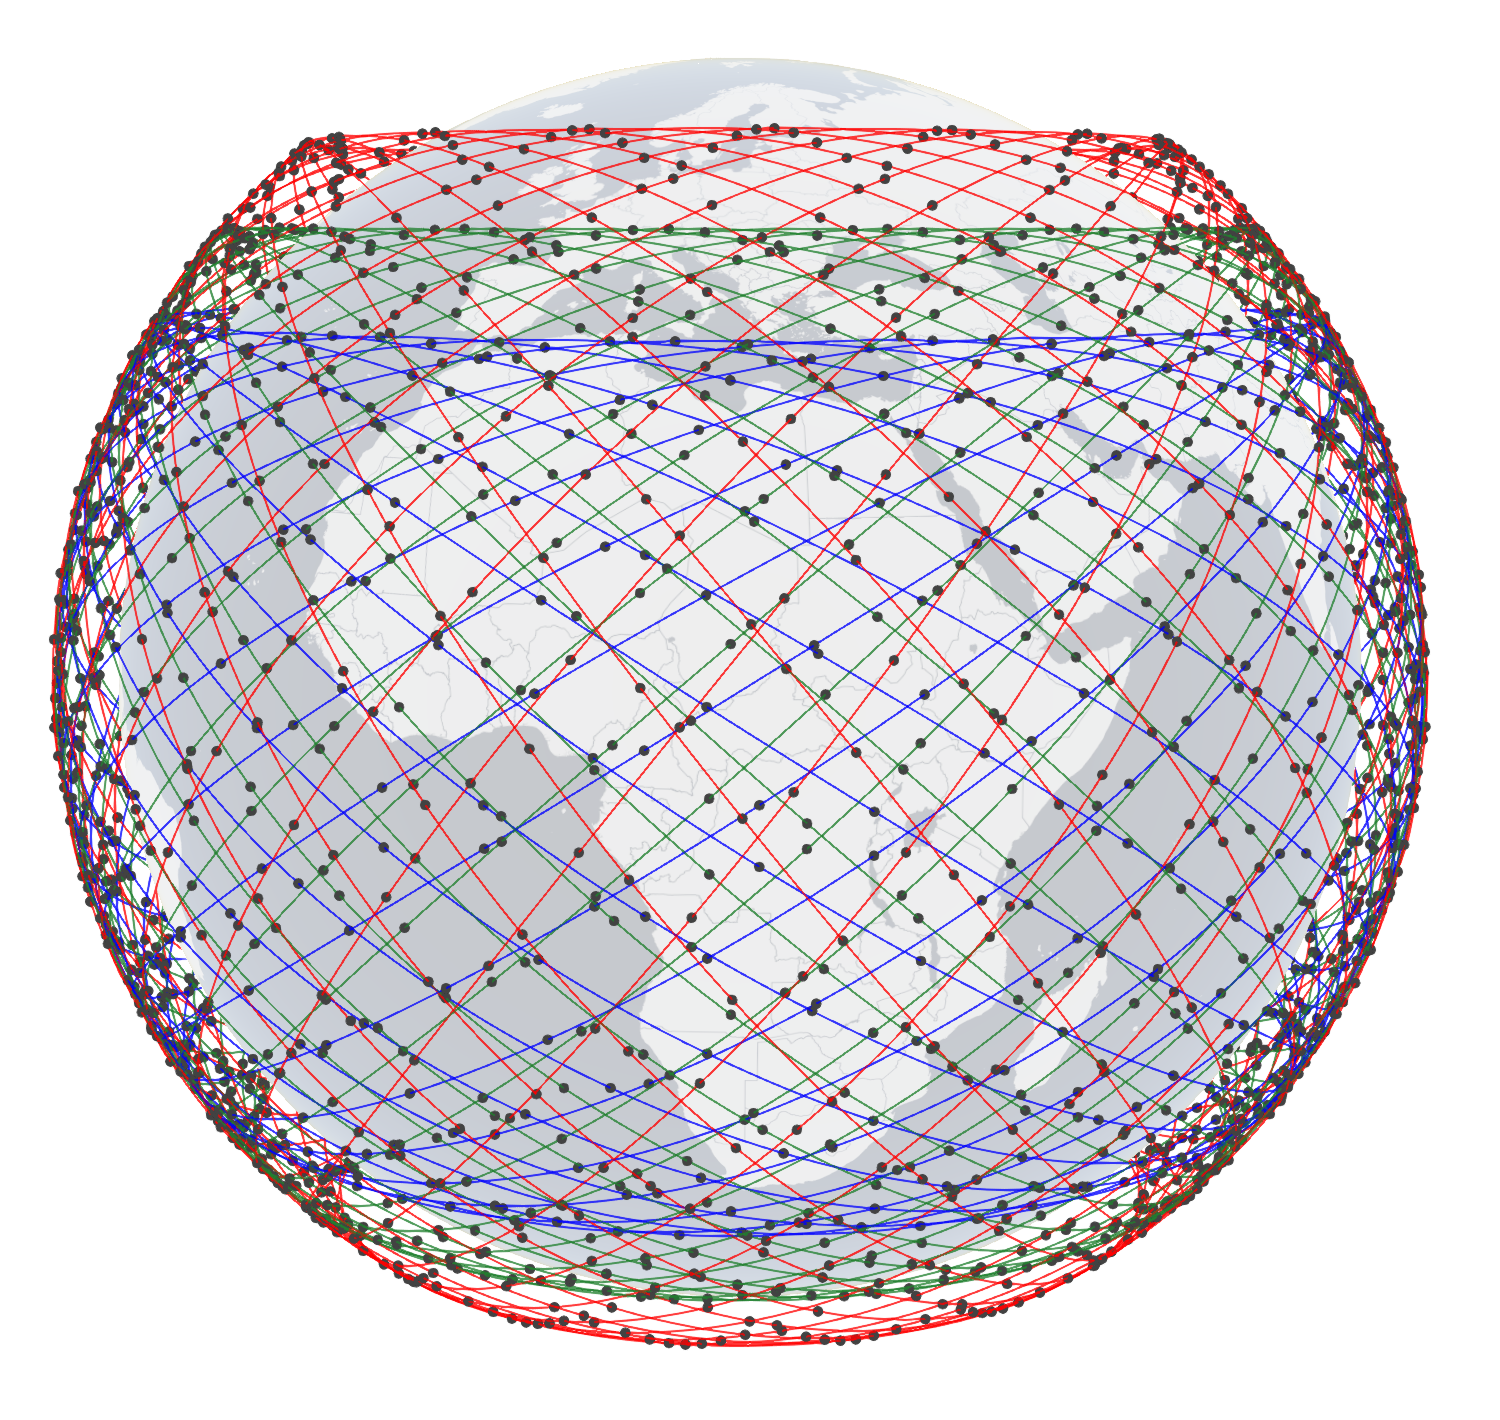
-
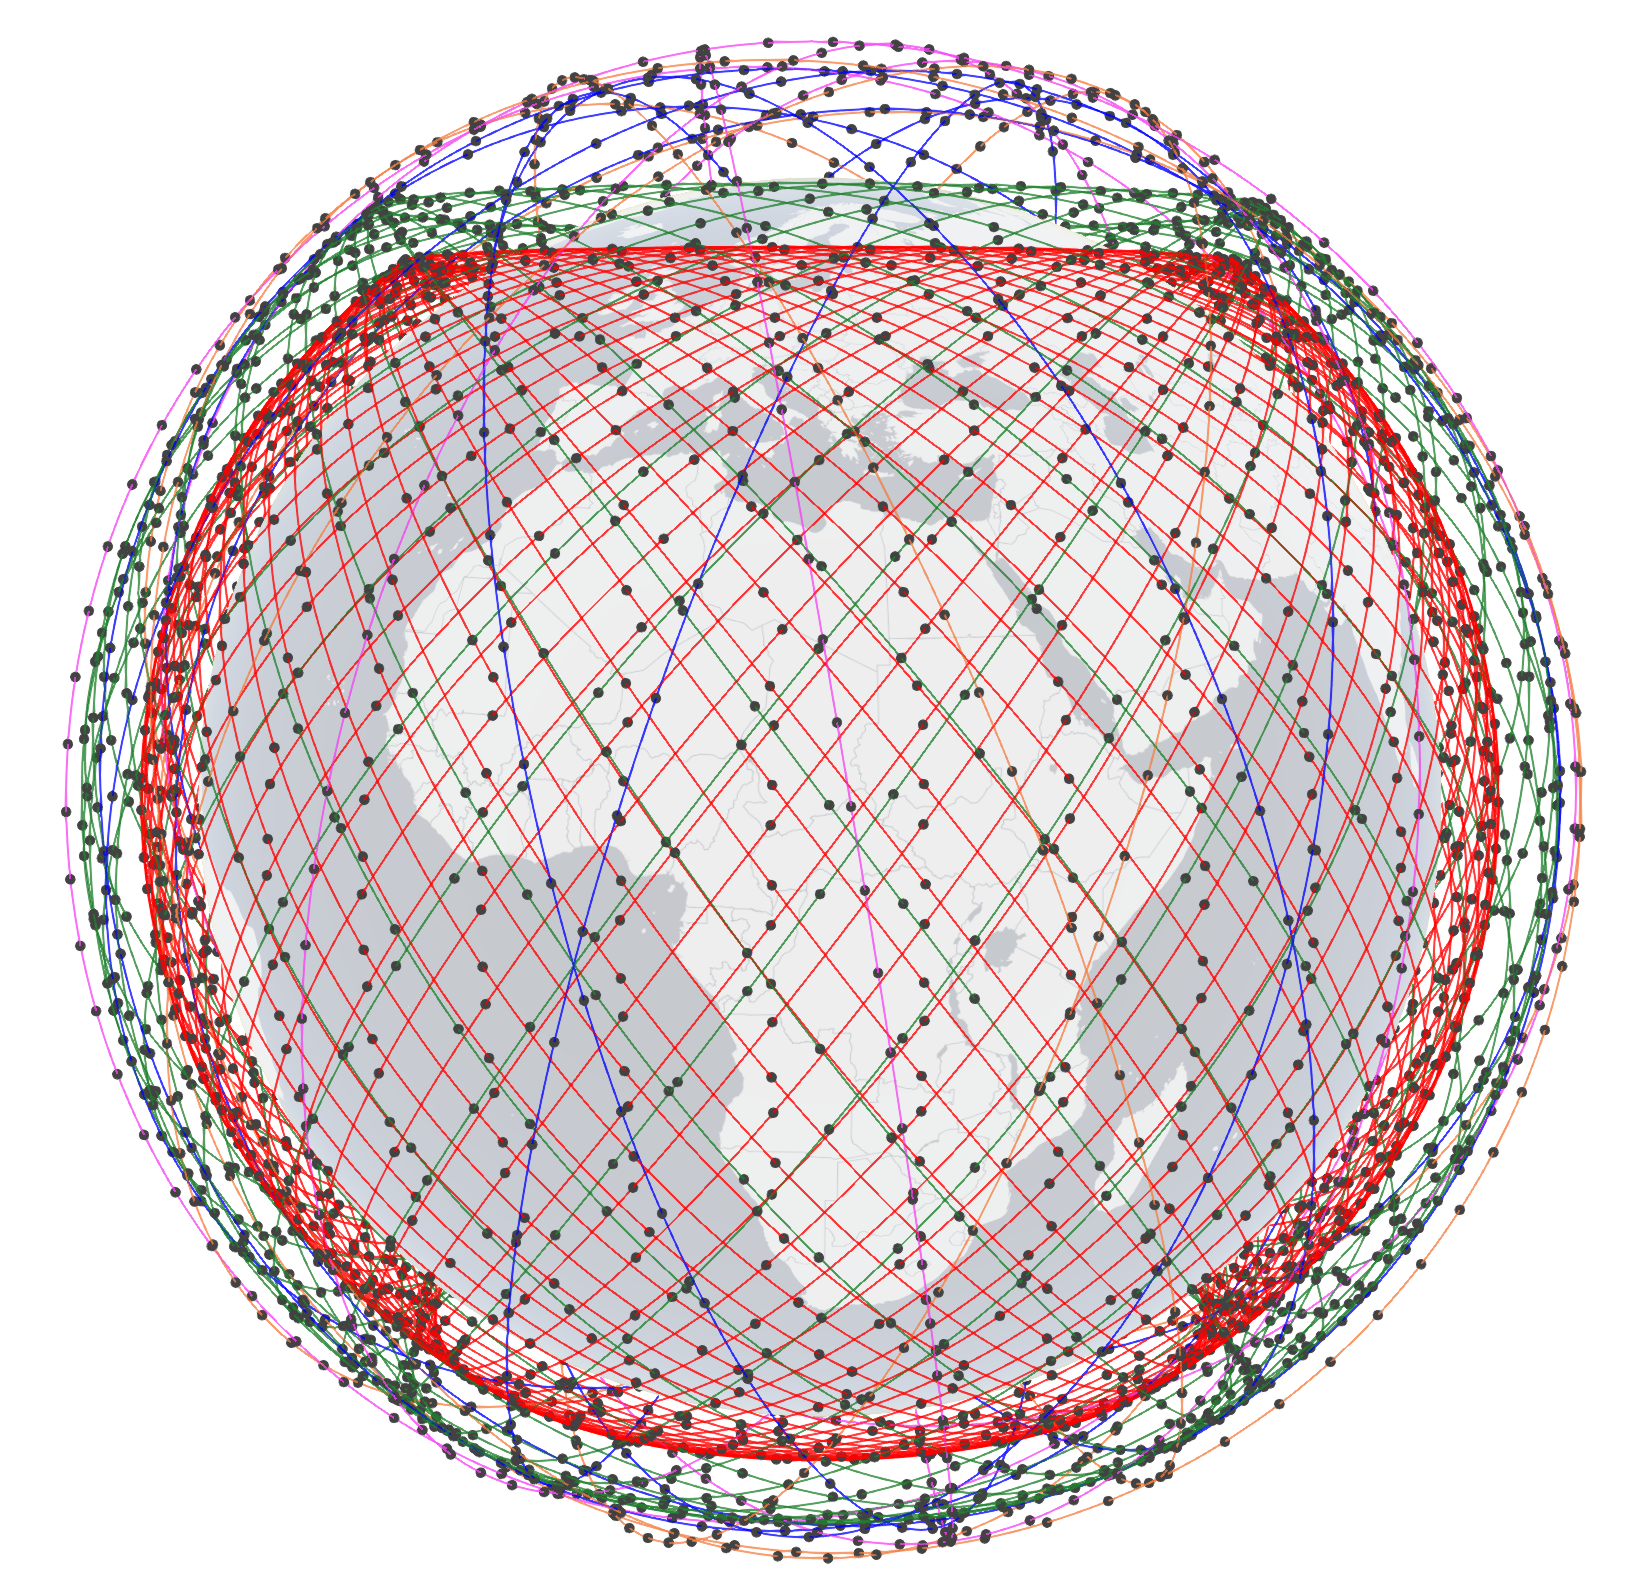
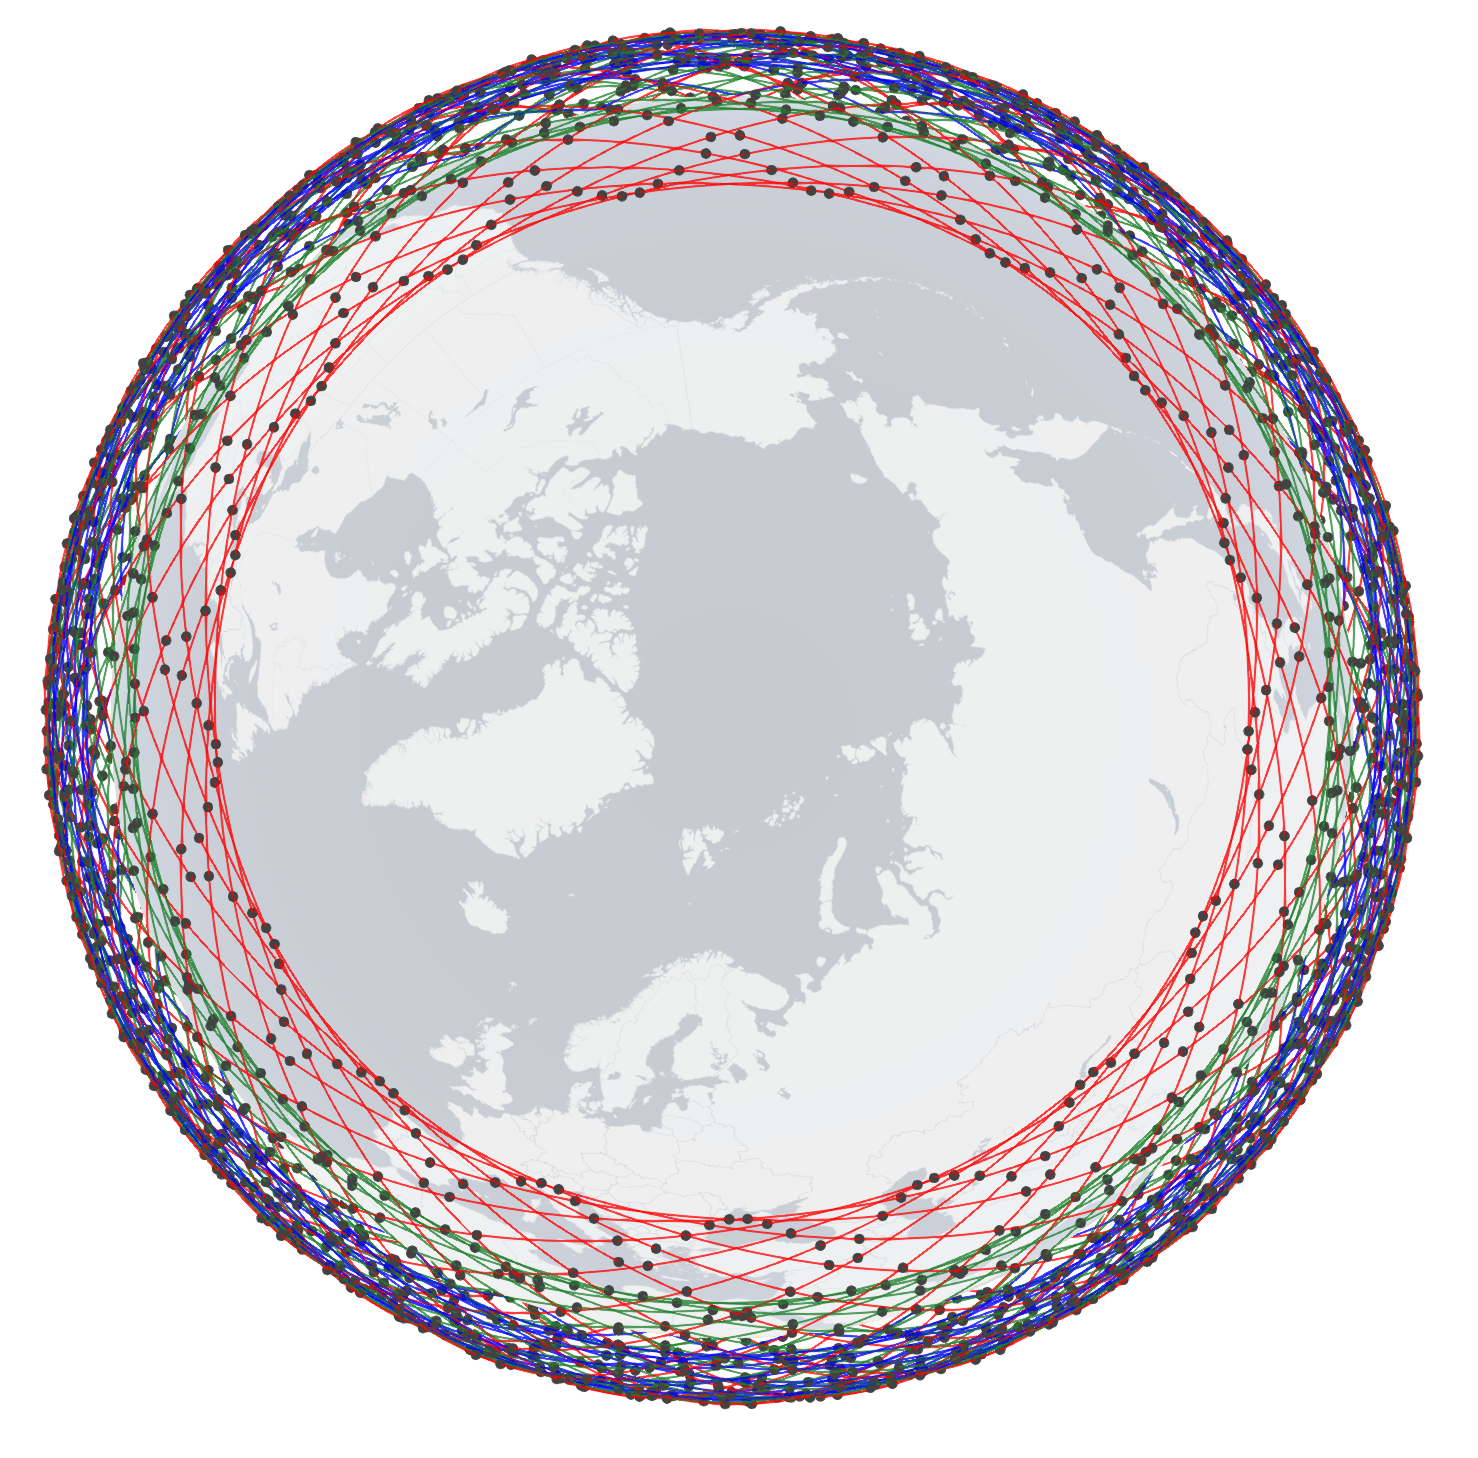
SpaceX Starlink 5-shell side-view (left) and top-view (right). To know the configuration of the shells, click here.
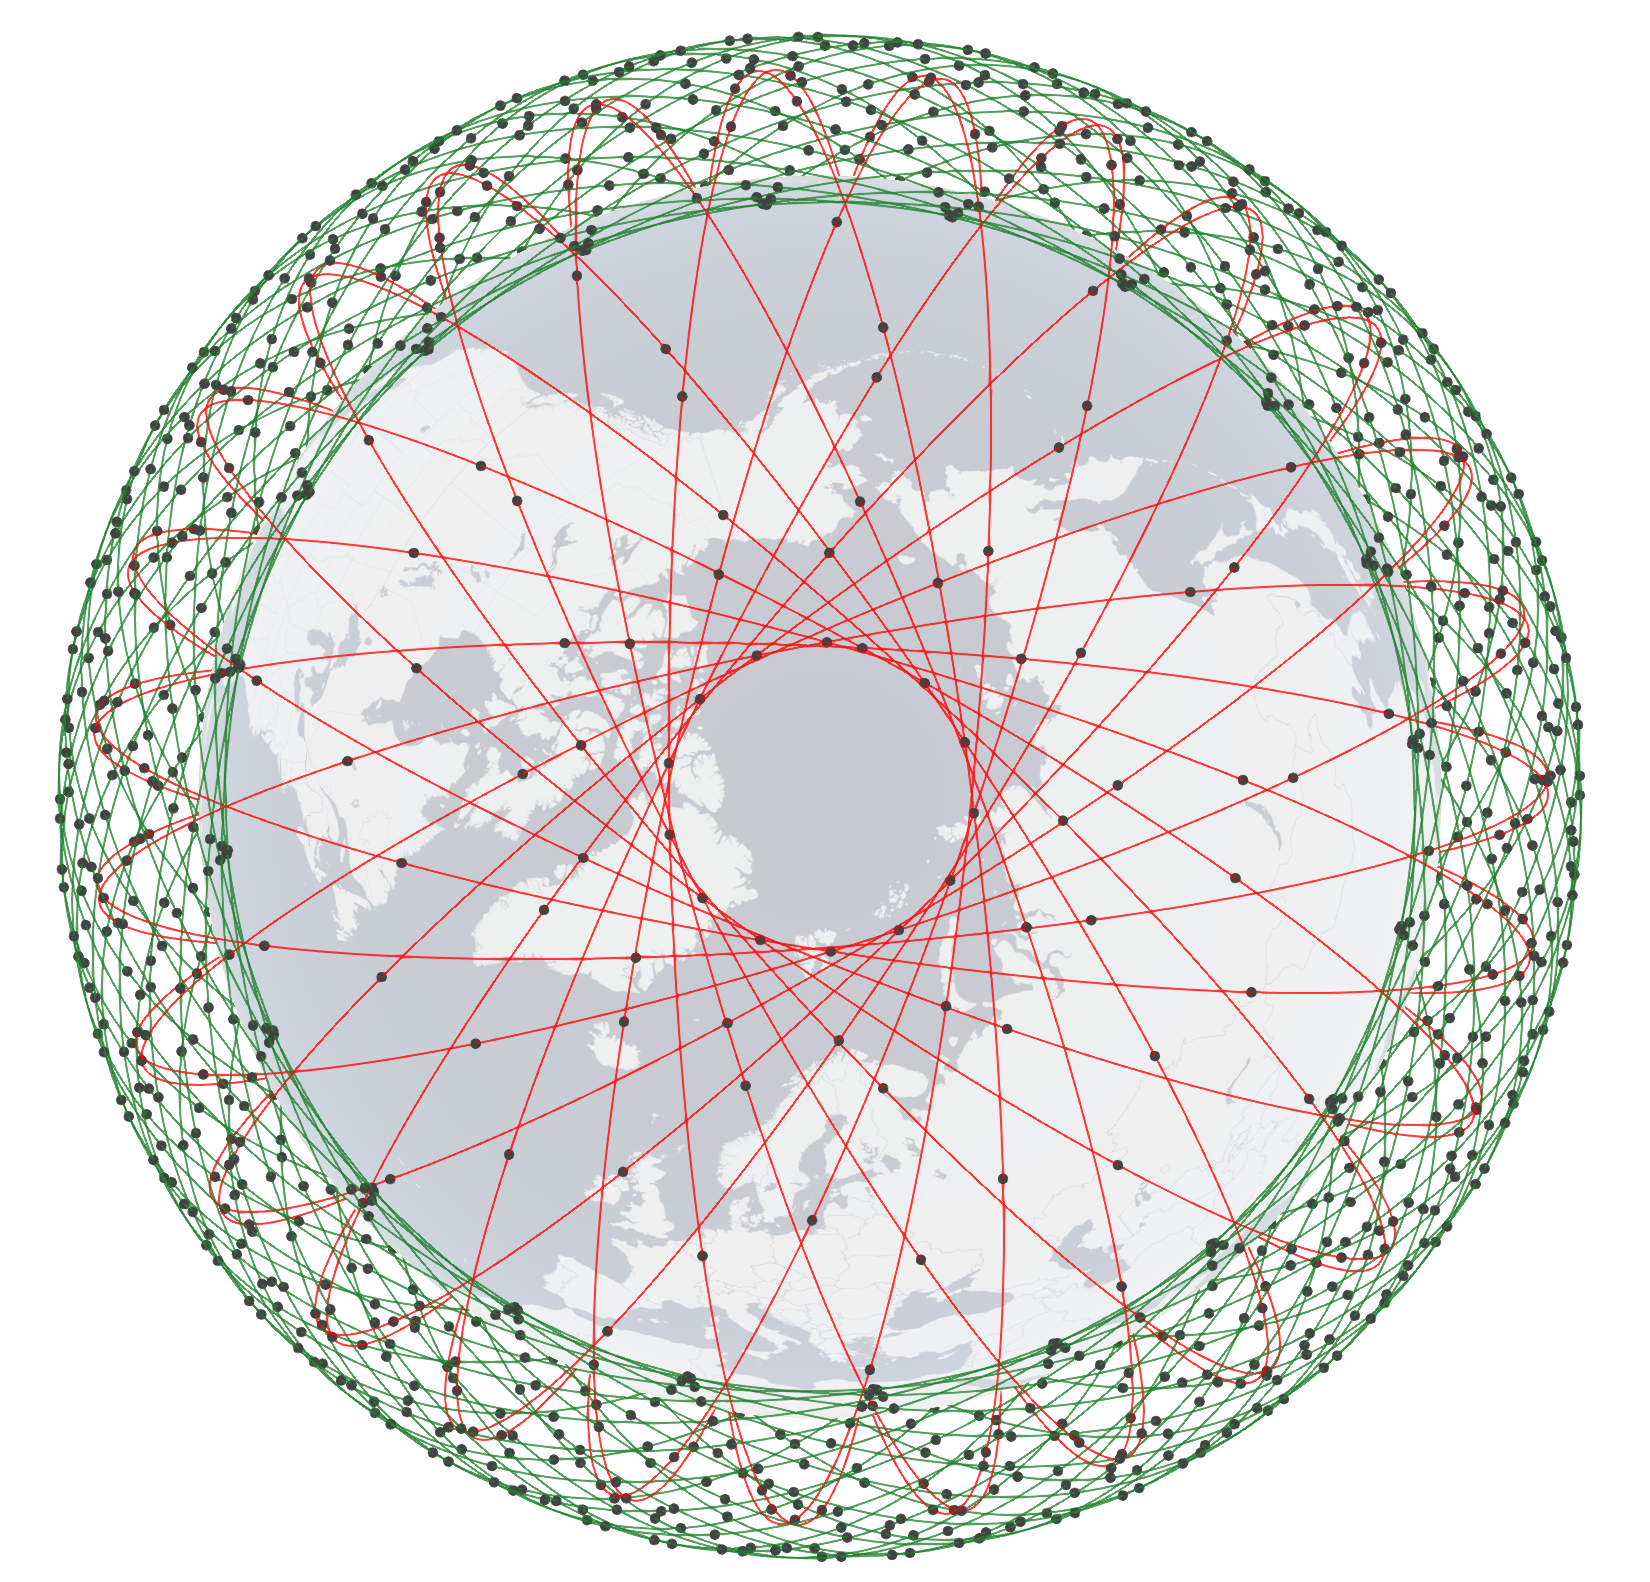
-
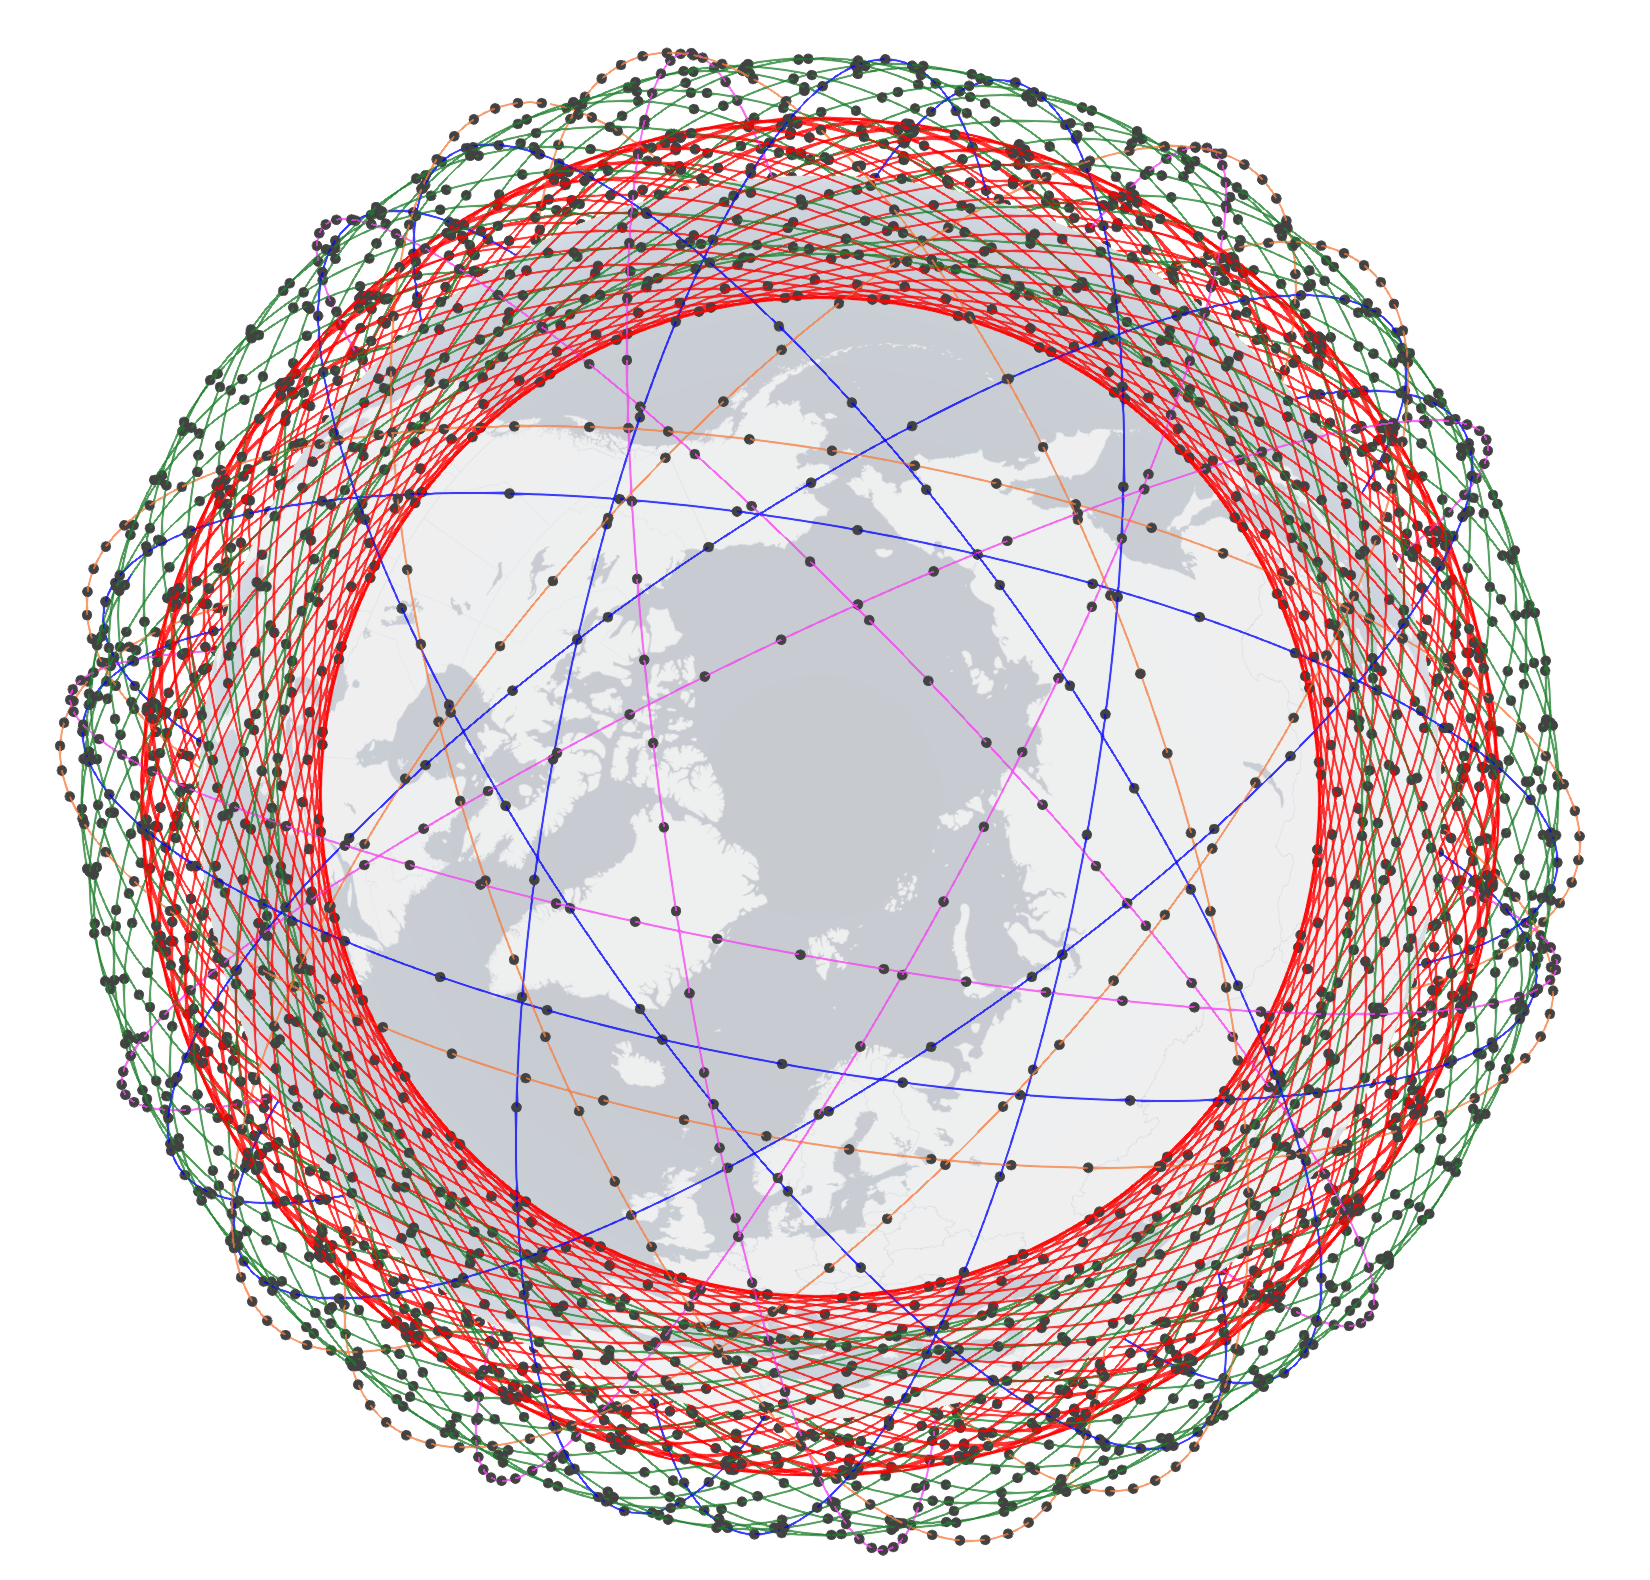
Amazon Kuiper 3-shell side-view (left) and top-view (right). To know the configuration of the shells, click here.
-
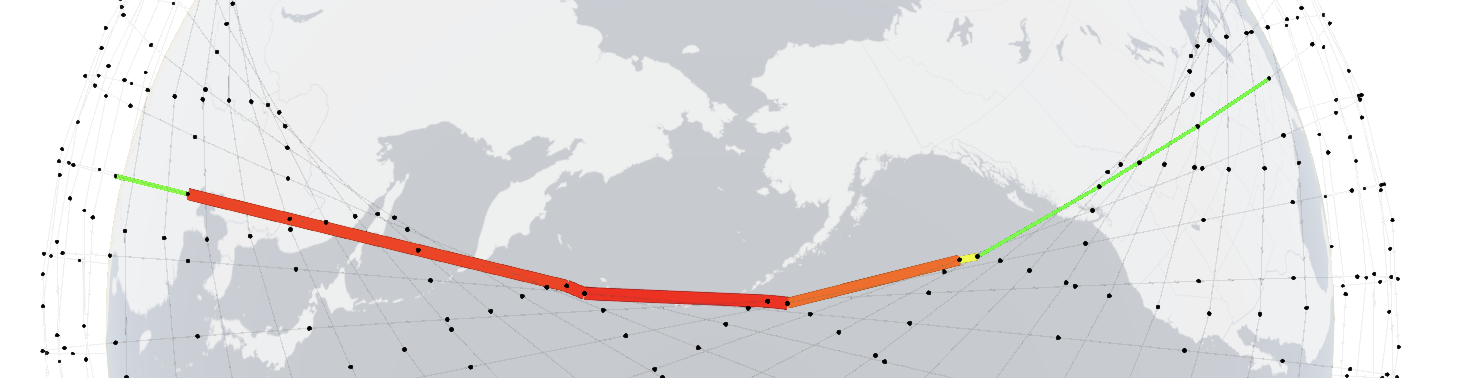
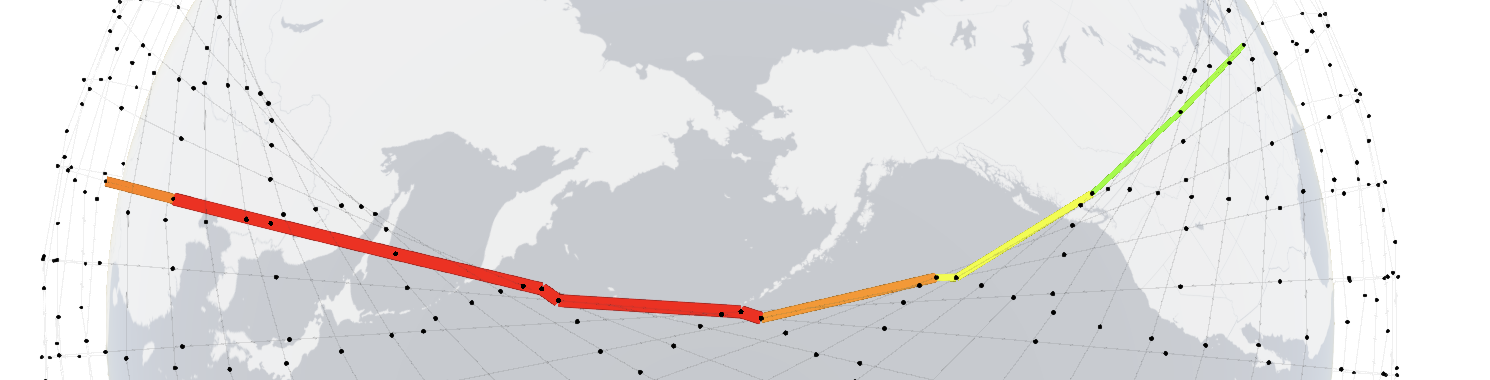
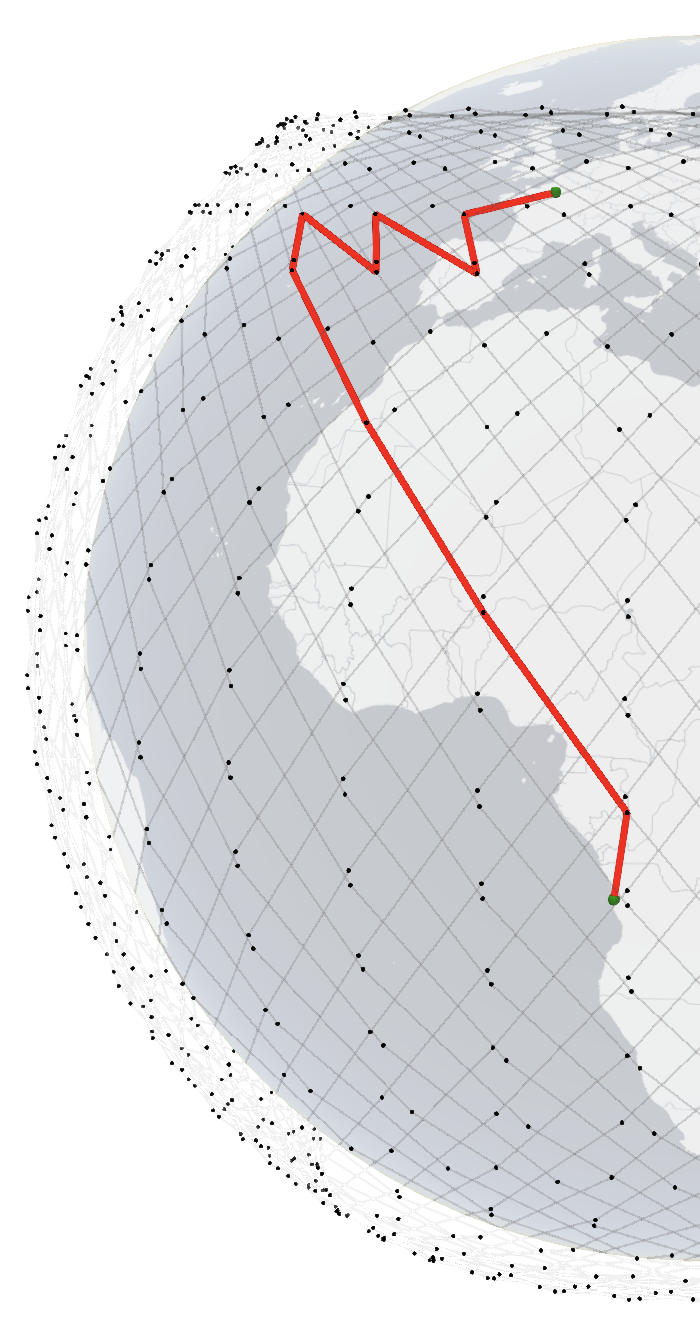
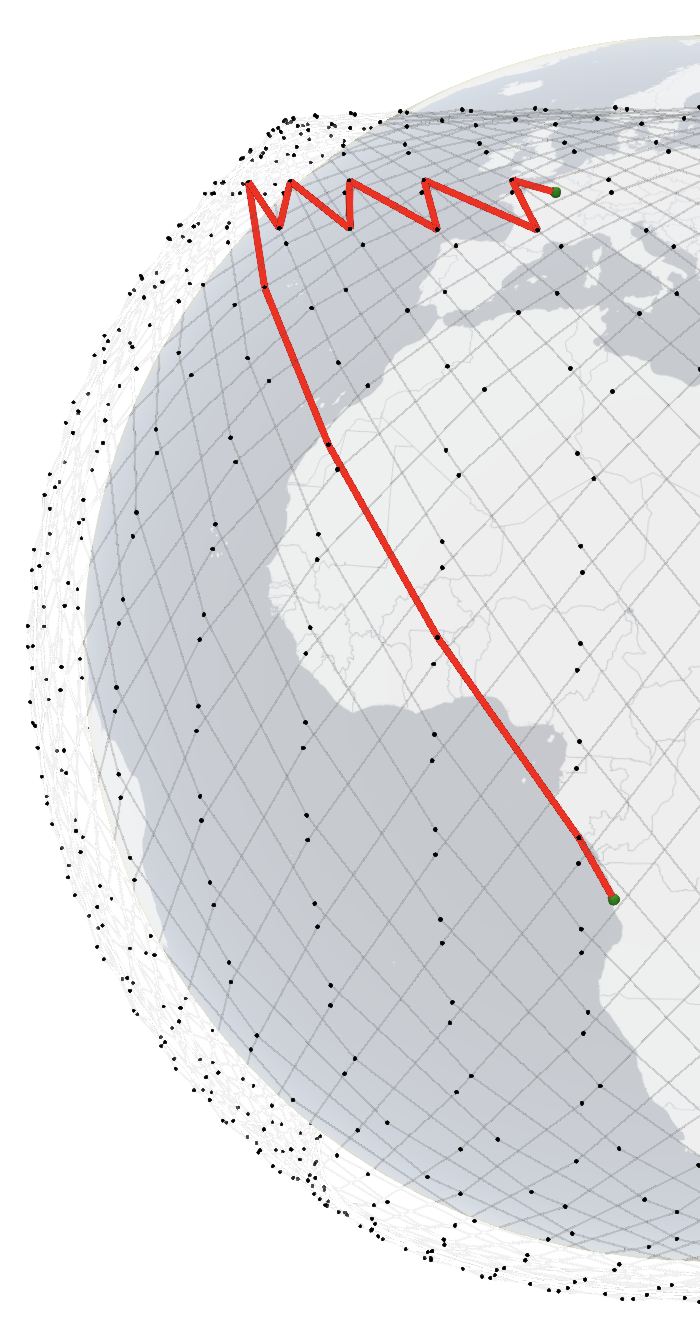
RTT changes over time between Paris and Luanda over Starlink 1st shell. Left: 117 ms, Right: 85 ms. Click on the images for 3D interactive visualizations.
-
Link utilizations change over time, even with the input traffic being static. For Kuiper 1st shell, path between Chicago and Zhengzhou at 10s (top) and 150s (bottom). Click on the images for 3D interactive visualizations.